
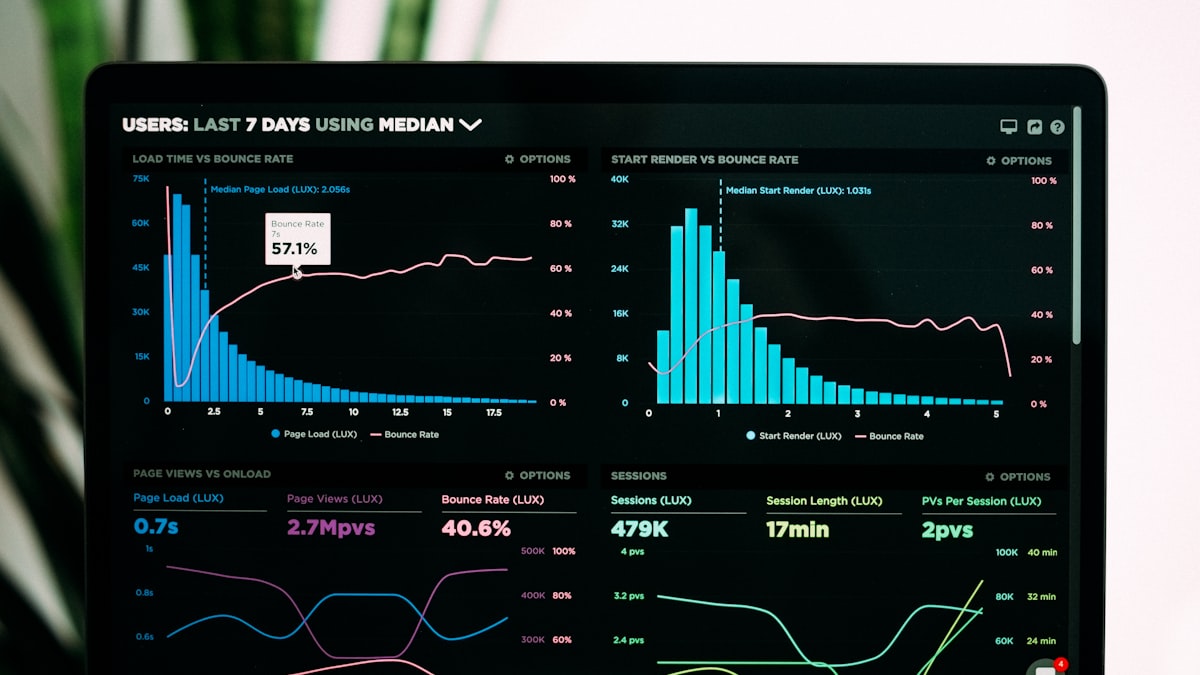
Every modern POS system offers you forty indicators. Takings, receipts, items per receipt, conversion, sales per square metre, per hour, per person. The paradoxical result is that the more numbers you have, the less you look: the crowded dashboard ends up like the crowded group chat, opened in a hurry and closed without having understood anything.
The problem is not which metrics exist. It is which ones deserve your attention, the scarcest resource in the store.
The action test
One filter alone removes three quarters of the noise: if this number got 20 percent worse tomorrow, what would we do differently? If the answer is "nothing" or "no idea", that metric is entertainment, not information. It can stay in the monthly report, but it has not earned a daily glance.
The metrics that pass the test are surprisingly few, and almost always the same ones: takings against the same day of previous weeks (not against yesterday), average basket when you change assortment or promotions, and one service metric of your choosing, whether that is queue length at the till or response time at the counter.
Noise has two factories
The first noise factory is the wrong comparison. Monday compared with Saturday always says Monday is failing; January compared with December always says you are going under. Every number only makes sense against its twin: same day of the week, same season, ideally the same promo and weather context.
The second is variance mistaken for trend. A small store has small numbers, and small numbers dance: Tuesday's collapse might be one missing group of tourists, not a problem. The practical rule: before reacting to a dip, wait for it to repeat. Three points make a line; one point only makes anxiety.
Metrics need their operational context
Here is the part almost everyone skips: sales numbers should be read next to who was on shift. The same Saturday, with four people or with two, produces different numbers with everything else equal. Conversion collapsing during the hours when the floor is understaffed is not a commercial problem: it is a coverage problem in disguise.
Which is why the most useful cross-reference for a store is not between two sales metrics, but between sales and staffing: takings per worked hour, till queues per coverage level. That is where you find out whether hours should move from Tuesday to Saturday, which is a real decision with real effects.
A short ritual beats an endless dashboard
Cadence matters more than quantity: five minutes every morning on your three chosen numbers, half an hour a month on the full picture. And one noted decision every time a number leaves its lane, even just "seen it, waiting for next week". At year's end, that log of decisions is worth more than all the charts: it tells you which signals you understood and which you missed.
That applies to the most elementary metric of all, the hours total: it goes wrong more often than you would think, and the method is in how to calculate worked hours.
The operational half of that cross-reference (who was in, how many hours, at which times) is exactly what Sked Solve keeps in order for you: the site shows what it looks like.